


Introduction & Background
The Economic Advisory Committee
The Economic Advisory Committee was created as part of Mayor Jane Castor’s mission for Transforming Tampa’s Tomorrow. Working with the Tampa City Council, the Mayor assembled a group of subject matter experts, key stakeholders, and community leaders to participate in this important effort. Representatives of the University of South Florida and the USF Muma College of Business chaired the Committee and facilitated its discussions, conclusions, and recommendations.
The Process
Mayor Castor kicked off the Economic Advisory Committee on August 19, 2020 and set the challenge for this Committee to undertake three key tasks: a ) assess the most widely used and universal ‘best practices’ engaged by cities to measure social and economic progress; b) based upon the assessment, identify metrics that reflect areas of importance for the City of Tampa, as a community, to focus on improving, and c) recommend tactical and strategic initiatives to improve the selected metrics over time.
The Advisory Committee convened over a 90-day period to carry out these tasks.
The work began by evaluating numerous data measures and information sources including dozens of metrics from the ‘State of the Region’ data developed by the Tampa Bay Partnership Foundation and the USF Muma College of Business in collaboration with the Community Foundation of Tampa Bay and United Way Suncoast. Data was presented from the ‘Regional Competitiveness Report’ which is a data-based assessment of Tampa Bay’s strengths and weaknesses across a diverse set of indicators, measuring performance against benchmark communities nationwide.
The Advisory Committee also reviewed findings and recommendations from related activities including the City of Tampa’s recent ‘Housing Affordability’ and ‘Workforce Development’ Advisory Committee Recommendations, the 2020 ‘Workforce Housing Initiative’ from the Tampa Bay Chamber, and an overview of resources available from Career Source Tampa Bay, a pivotal partner to the City and the community to help closer the regional skills gap.
Following this review, the group focused its recommendations on the following focus areas:
- Promote Inclusive Economic Growth
- Reduce Poverty
- Emphasize Educational Opportunity
Within these focus areas, the Advisory Committee identified ten specific measures that, if improved, could positively influence the focus area. As part of this exercise, it was important that each selected measure meet the following criteria:
- Be a recognized metric for measuring economic prosperity,
- Be easily measured at the local level specific to the City of Tampa (rather than the region or MSA), and
- Be readily accessible and trackable over time, ideally by the ‘State of the Region’ initiative, to enable the community to continuously track progress and assess whether implementation of the recommendations made a difference.
With the criteria in mind, the Advisory Committee identified the following ten measures to focus on:
- Promote Inclusive Economic Growth
- Per Capita Income
- Unemployment Rate
- Reduce Poverty
- Poverty Rate
- Transportation to Work
- Digital Access
- Emphasize Educational Opportunity
- 4th/8th Grade Math Florida Standards Assessment (FSA)
- High School Graduation Rate
- Educational Attainment (Bachelor's degree and above)
After identifying the measures, the Advisory Committee worked to identify tactical and strategic initiatives to improve the trend of each selected metric. The recommendations are intended to help drive a common pathway to achieve positive progress.
The need for this assessment was amplified by the impacts of the COVID-19 pandemic which struck the Tampa Bay area as it did across the globe, presenting unexpected new challenges. Some of these challenges impacted underserved individuals and communities harder than others. The impact of the pandemic is yet to be fully appreciated, but the need for tactical and strategic initiatives to help improve economic growth and prosperity are stronger than ever.
Current State of Economic Growth and Prosperity in Tampa
The City of Tampa is experiencing rapid growth. Major public and private investments are transforming its physical landscape, and new residents and businesses are arriving daily.
The Advisory Committee reviewed this data as part of its initial assessment, including Tampa’s position next to competitive cities across the country. For this exercise, the City of Tampa’s economic performance was compared to five other comparable cities:
- Charlotte
- Minneapolis
- Nashville
- Orlando
- Seattle
These cities were selected based on factors such as population and demography, size of the economy, presence of regional assets such as ports and research universities, and the frequency of competition for economic development projects. The selected cities reflect both peer and aspirational relationships with Tampa.
In reviewing the comparative data there are many positive trends to capitalize and build upon. Tampa ranks second in ‘business establishment start rate’ reflecting a dynamic business environment and continued optimism in the economy. And for the first time in four years the region experienced positive export growth. In addition, the region’s housing prices have stabilized in relation to the national average.
However, the City of Tampa has lower rankings for certain critical economic prosperity measures as compared to its municipal competitors. For example, job growth rate is improving, but is still at a five-year low and Tampa Bay ranks last among other Florida metro areas. The share of jobs in highly desired advanced industries has also increased competitively, but without providing the expected value to the regional economy, particularly in the form of higher wages. The local average wage trails all but one community, and the average wage in the service sector continued a downward trend below the national average. In household income, Tampa Bay continues to rank below its competitive cities, however this measure is based upon census bureau data and does not account for the cost of living index which is highly variable among these cities.
The assessment also revealed several drivers of economic prosperity, including for poverty, income, and unemployment. For example, there is a direct correlation between transit availability and poverty rate. Likewise, there is a correlation between educational attainment and Gross Regional Product (GRP) per capita. The assessment indicated that incremental improvements in measures such as transit availability and educational attainment can make direct meaningful changes in a community’s poverty rate and GRP per capita.
Summary of Current Economic State
These preliminary findings highlight the interdependencies of economic measures and the importance of an inclusive and coordinated response to drive positive outcomes. While the MSA and the City of Tampa have many positive measures and trends, there is much opportunity for improvement on several key measures concerning socio-economic prosperity. The measures identified for targeted action are intended to break the cycle of poor performance and enable the City to grow its economy across all neighborhoods and communities.
General Findings
Following the assessment and evaluation of relevant data, the Advisory Committee identified ten measures to focus on. The selection of these measures was based upon three specific criteria that the group felt was critical for it to measure progress over time. First, the measure had to be an established and universally acceptable metric. Second, the measure had to be trackable at the local, municipal level (vs at the MSA level). And third, the measure had to be measurable over time by the Tampa Bay Partnership’s State of the Region initiative.
The goals for each measure vary slightly. For example, one of the measures has been trending downward, so the objective is to reverse that trend. However, half the measures reflect recent positive progress, therefore the objective is to focus efforts to continue to achieve positive outcomes, and where possible accelerate them. Finally, several of the measures are stubbornly fixed and consistently under-performing, but not worsening in competitive position. The intention for these would be to break the cycle and initiate a turn toward incremental positive improvement.
Following are the ten measures selected by the Advisory Committee and the competitive standing for each one.
Promote Economic Growth
The mean income for every person living in a city. It is derived by dividing the total income generated in a city in the past 12 months by the total population of the City.
Tampa has persistently been ‘middle of the pack’ in this measure but recently began declining further, a trend that needs to be reversed.
- Per Capita Income - The mean income for every person living in a city. It is derived by dividing the total income generated in a city in the past 12 months by the total population of the City.
Tampa has persistently been ‘middle of the pack’ in this measure but recently began declining further, a trend that needs to be reversed.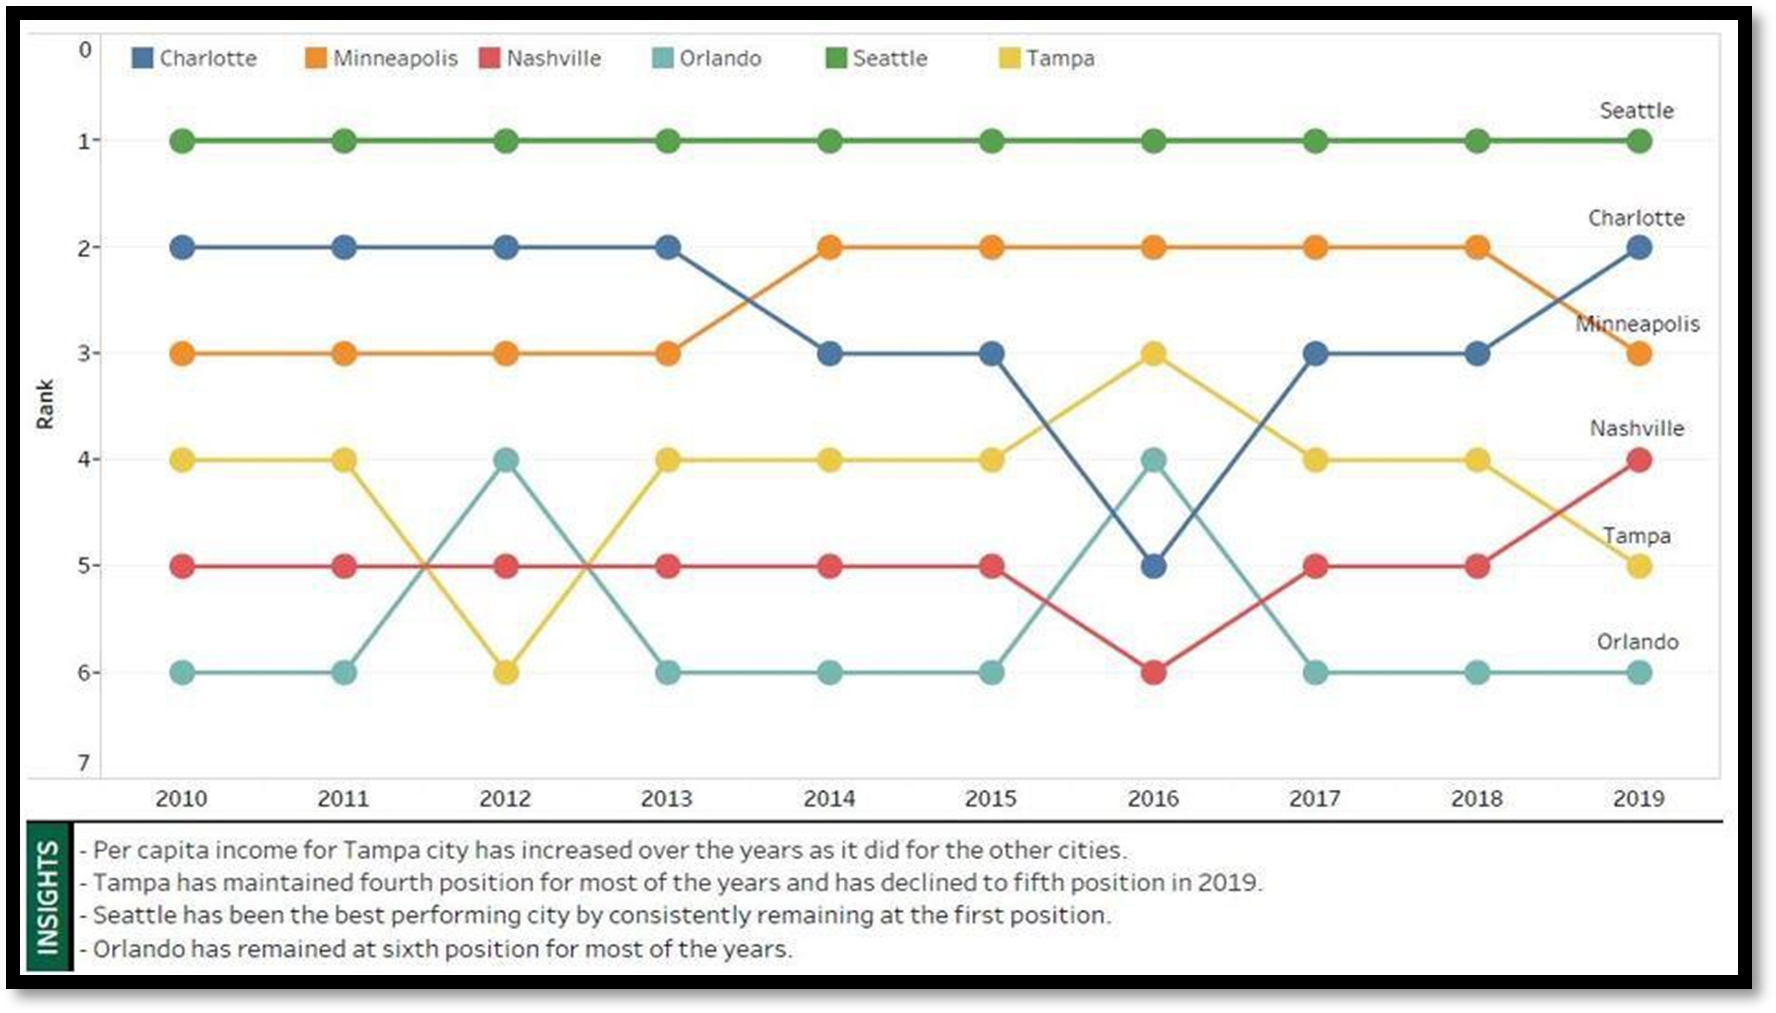
- Unemployment Rate - The percentage of the labor force that is without employment. An individual is considered unemployed if he/she is willing and able to work but unable to find employment.
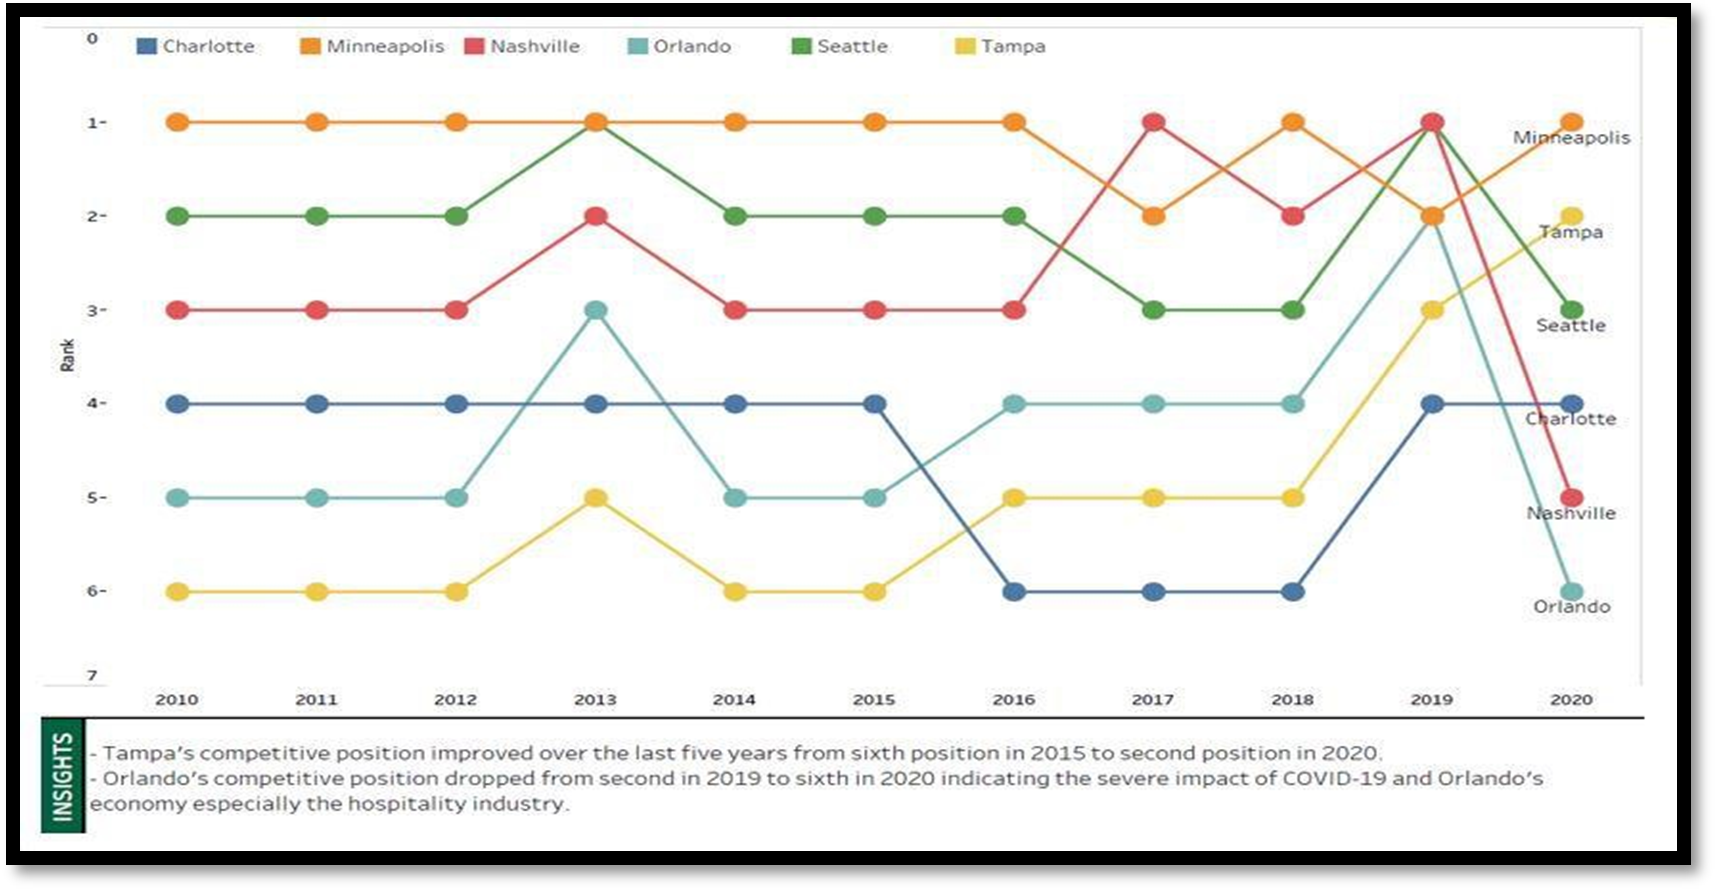 Tampa has performed poorly against its competitors for some time, but recently improved. An improving trend over the past three years needs to be sustained.
Reduce Poverty
- Poverty Rate - The percentage of the population that is living below the federal poverty line defined by the U.S. Census Bureau. For Tampa, the poverty level thresholds in 2019 were: 1-person household: $13,011; 2-person household: $16,521; 3-person household: $20,335; and 4-person household: $26,172.
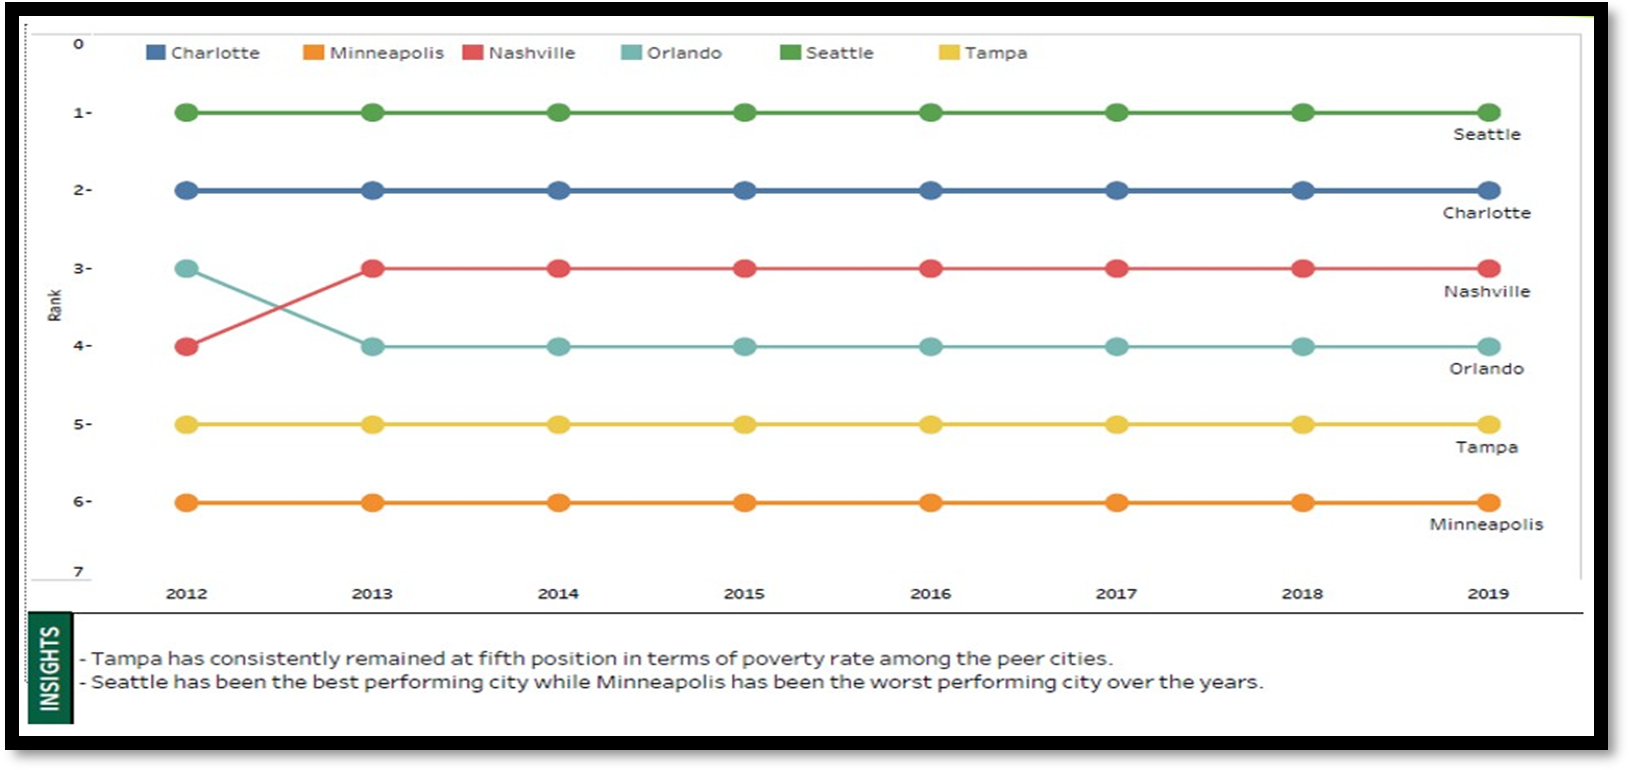 Tampa has stubbornly held a low ranking in this measure over time and will look to break this cycle with incremental improvements.
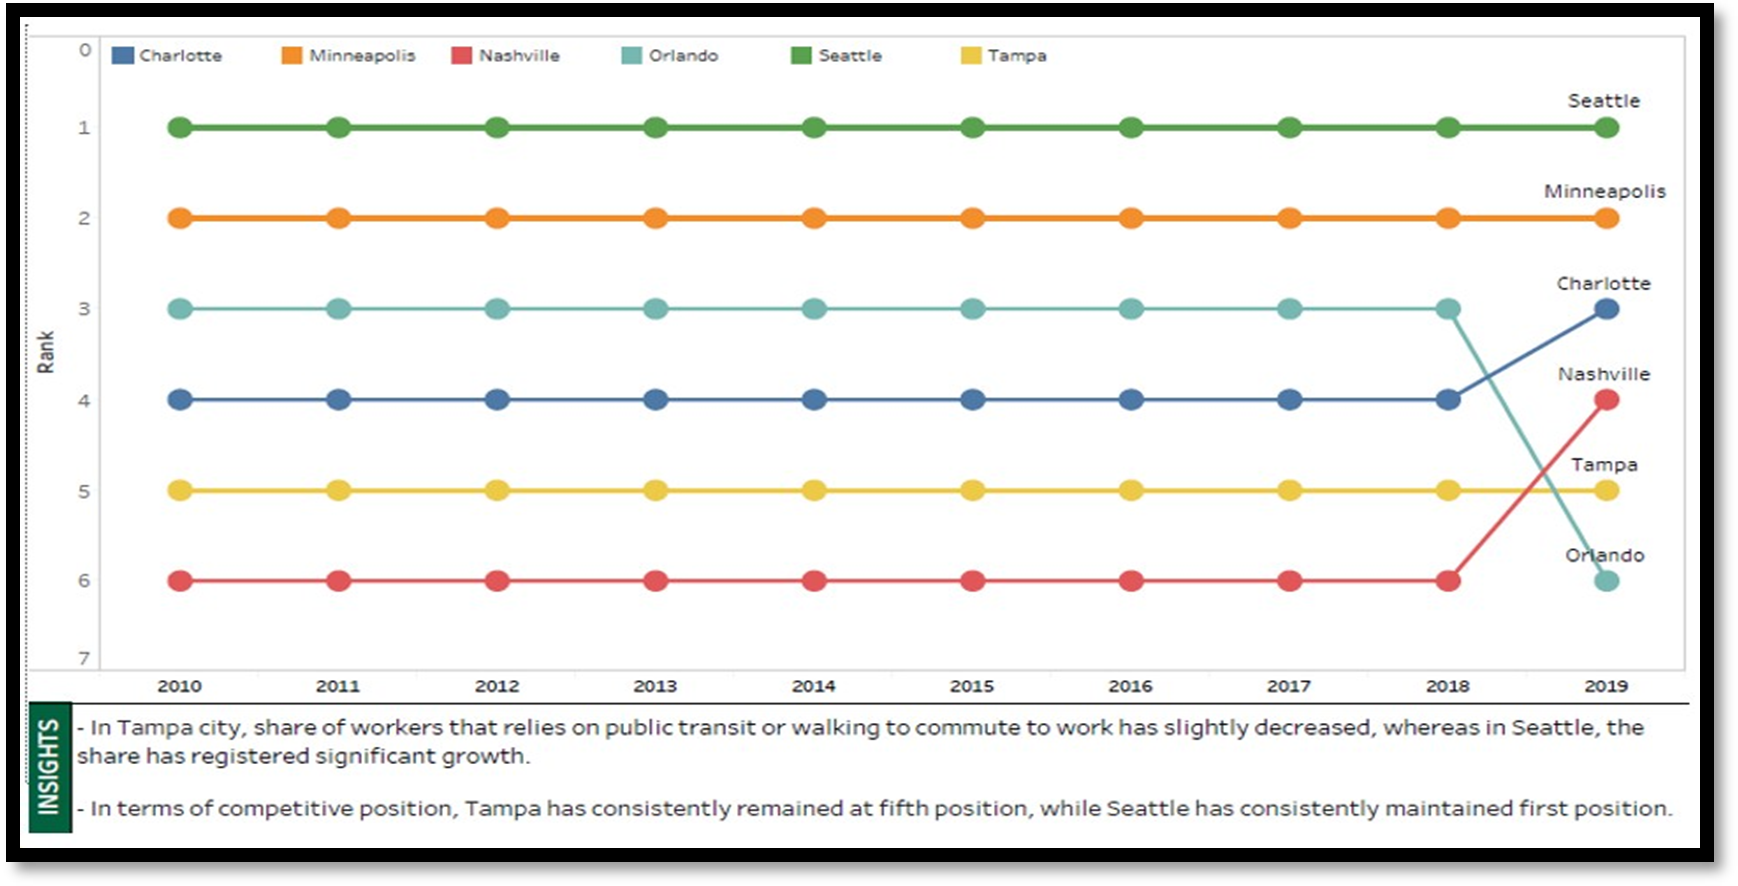
- Transportation to Work - This metric measures the proportion of workers aged 16 years and older that rely on public transit or walking to commute to work.
Commute times in Tampa Bay declined slightly from prior year but are still growing faster than the national average. The region offers few alternatives to car travel as seen in its low ranking in transit availability and ridership. Unfortunately, the competitive gap is widening as other communities make critical transportation investments.
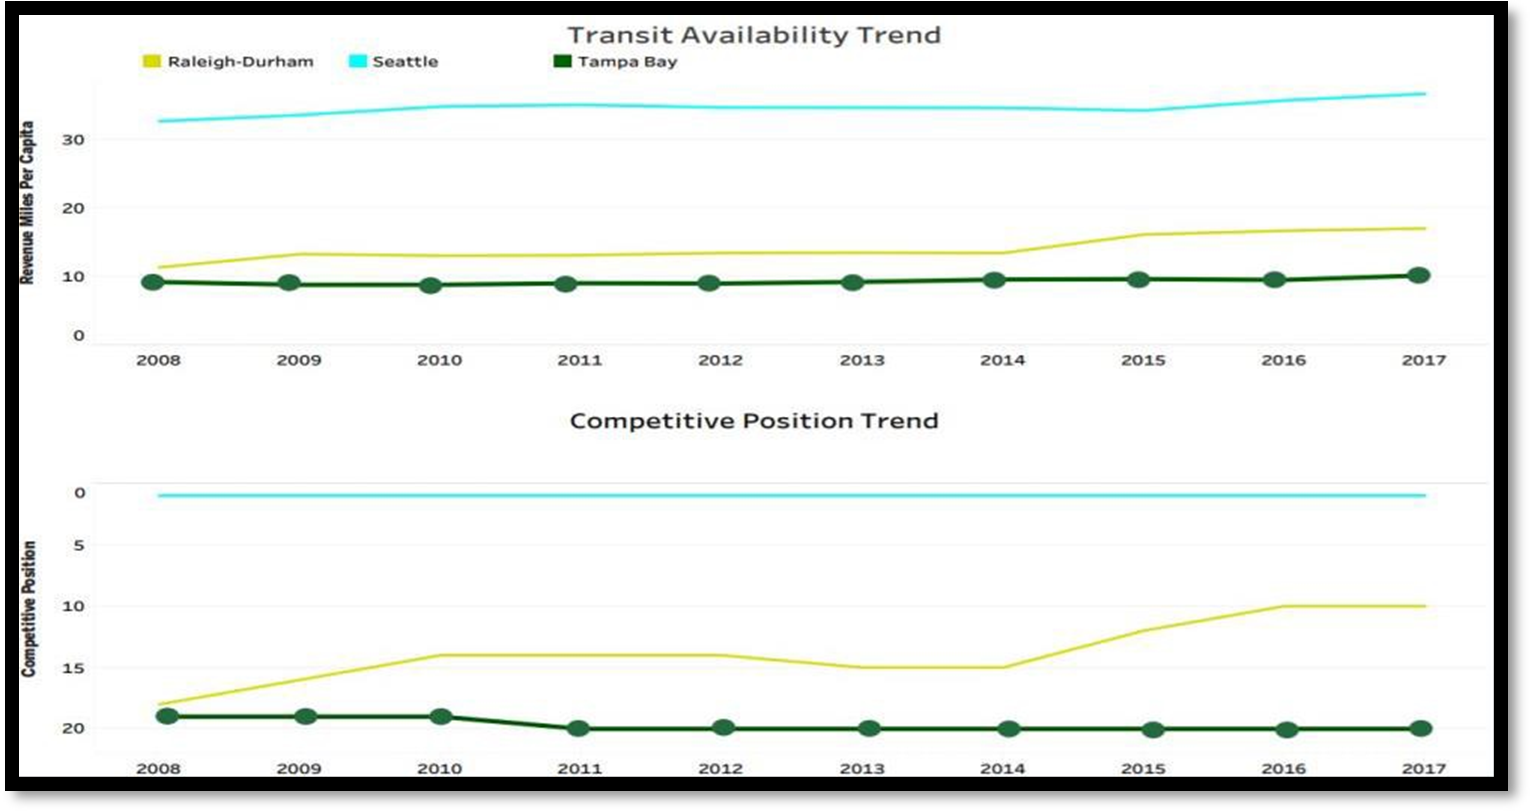
About: Measures, on a per capita basis, the number of miles traveled by public transit vehicles during revenue service, meaning that the vehicle is transporting passengers while on the road. Source: Federal Transit Administration, National Transit Database, Annual UZA Sums.
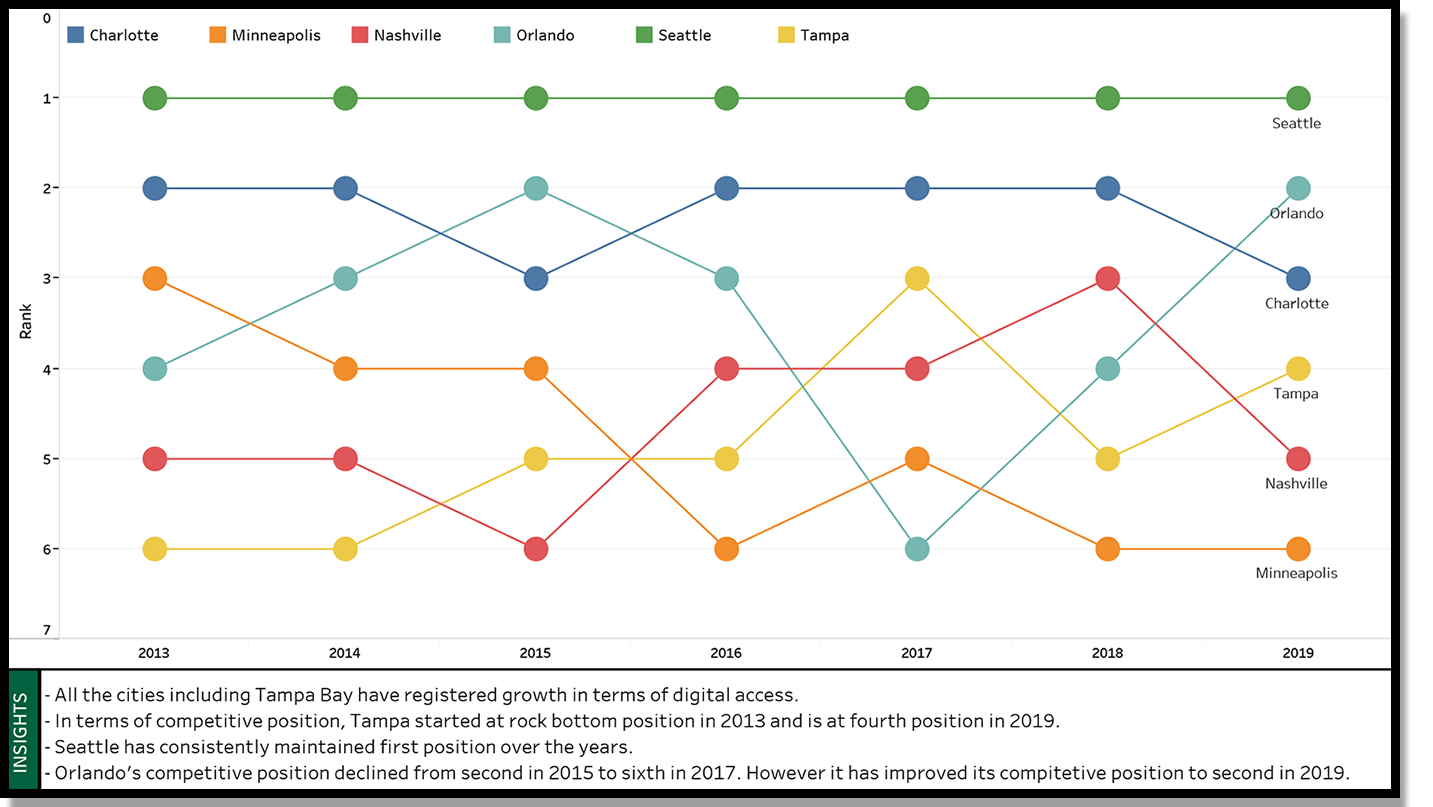
- Digital Access - The share of households with a computer and a dedicated physical broadband such as fiber optic or DSL.
- Tampa has shown positive but inconsistent progress on this measure and needs to be able to support a year-over-year consistent positive trend.
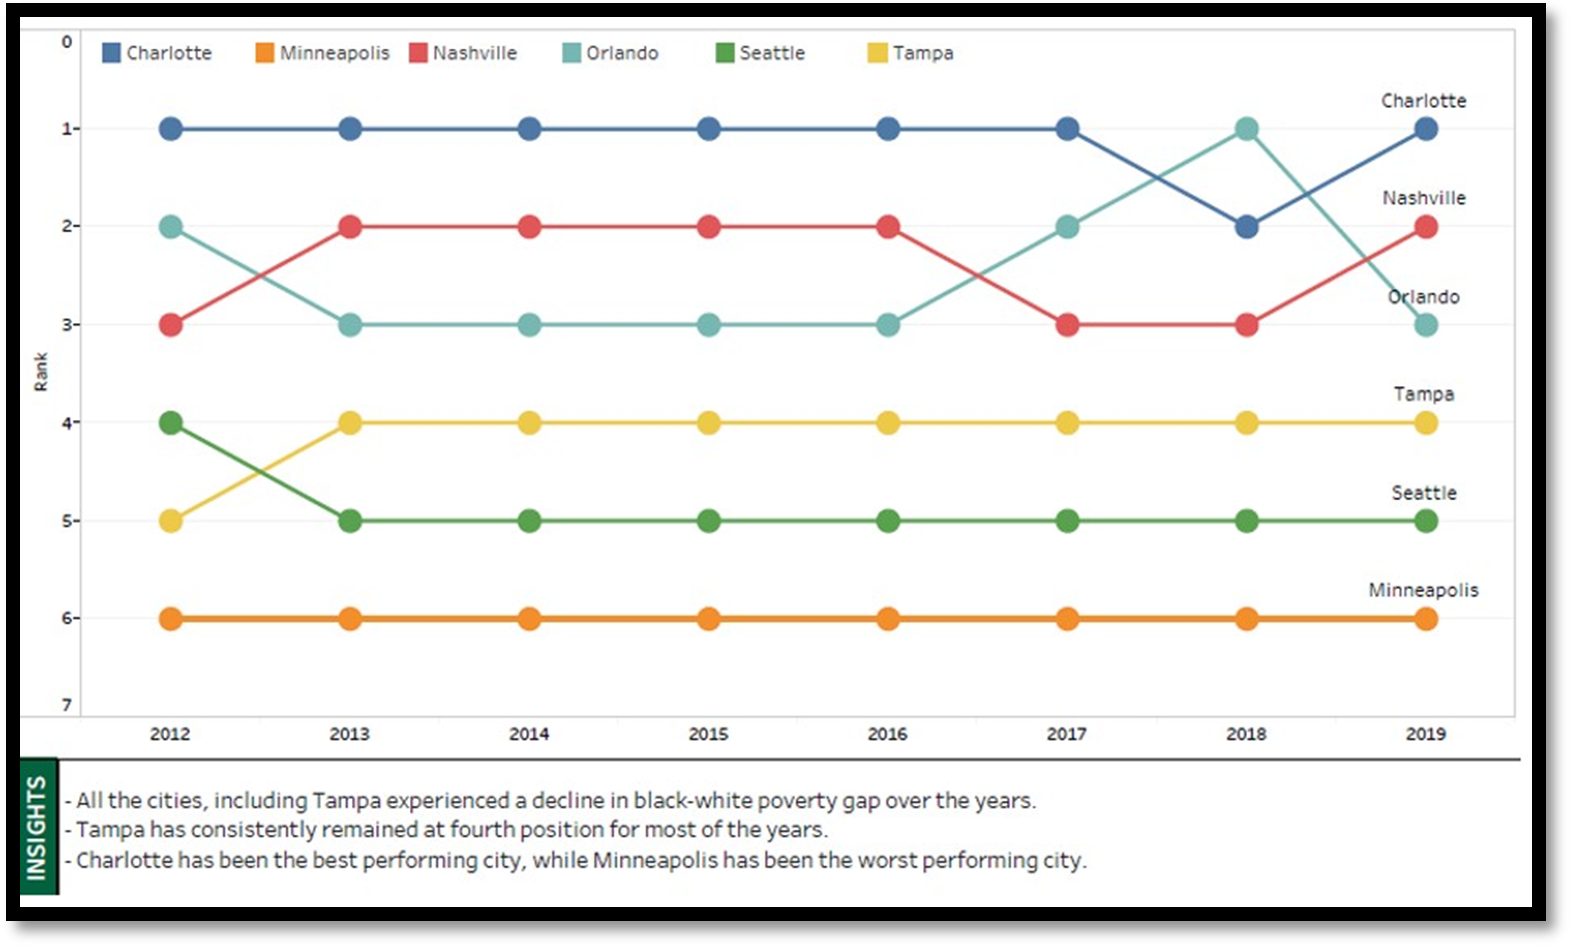
- Racial Poverty rate gap - The black-white gap in share of workers working fulltime with income below the poverty line (calculated by comparing the average poverty rate for African Americans vs White-Americans).
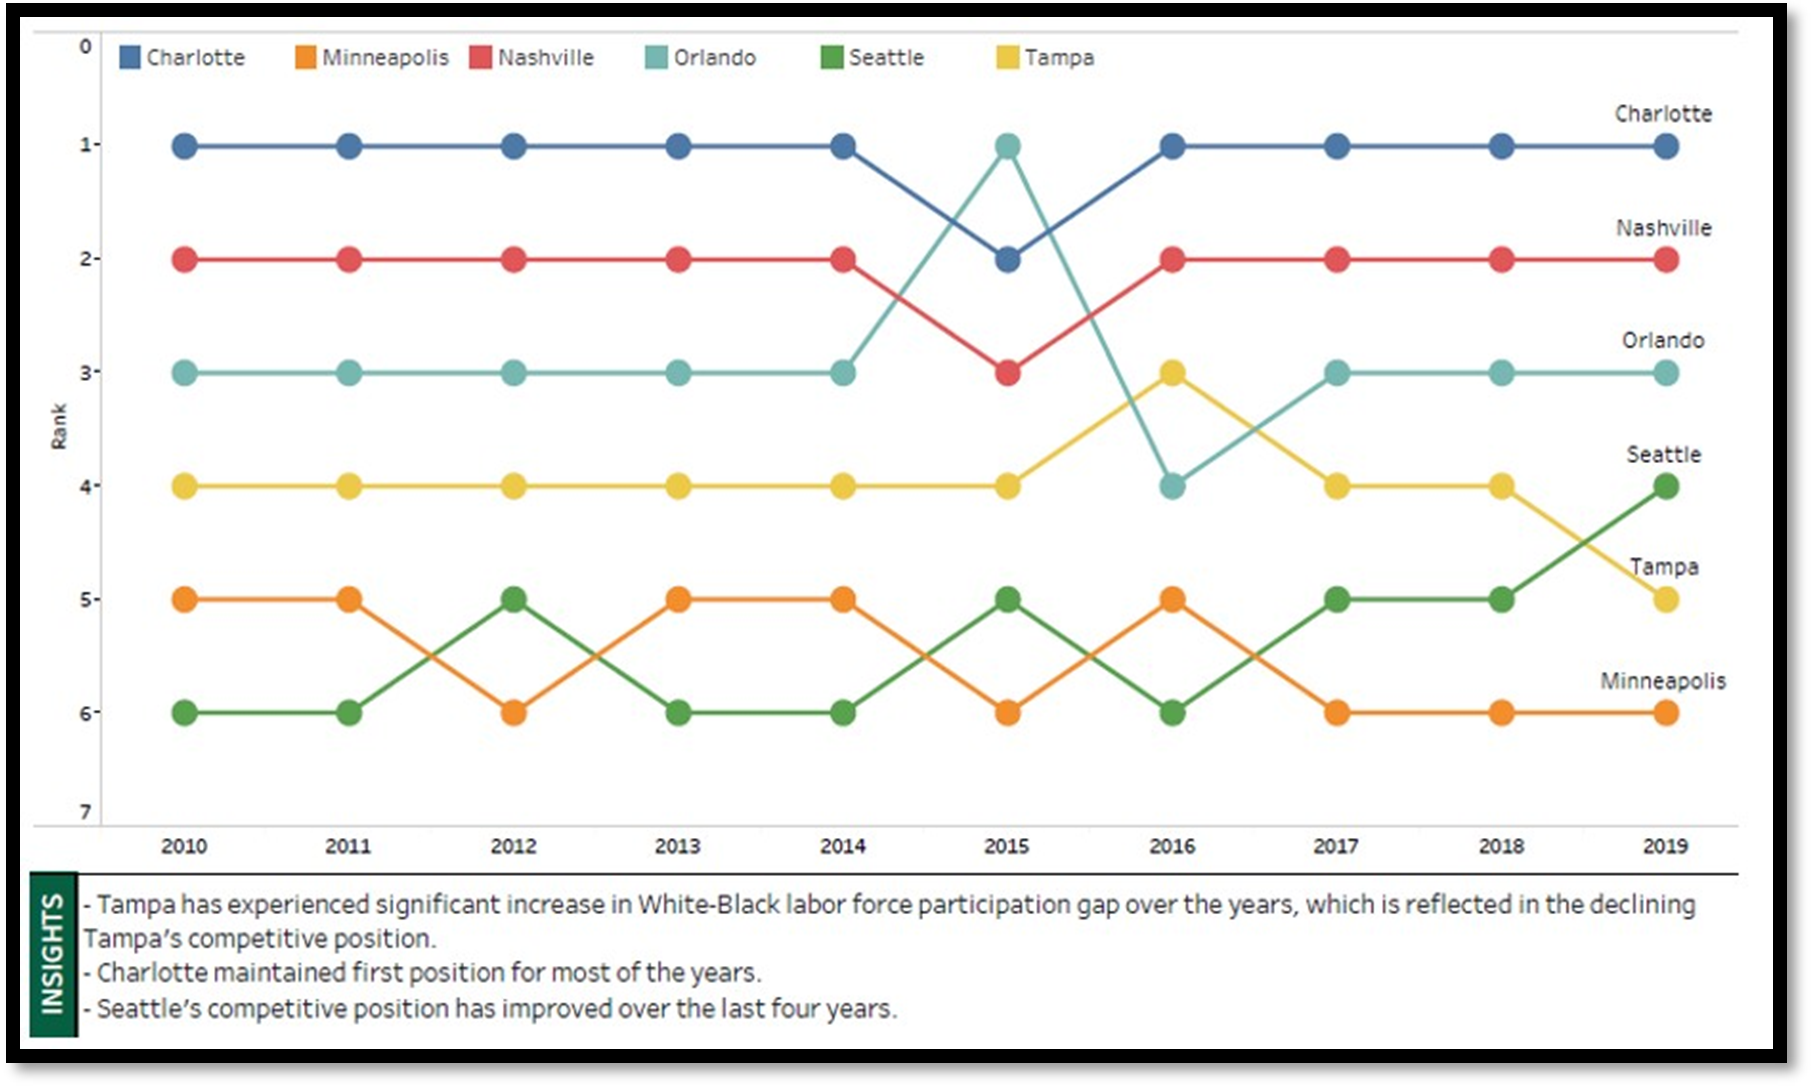
- Racial Labor Force Participation Gap - The black-white gap in the percentage of the population 16 years and older that is either working or actively looking for work (calculated by subtracting the labor force participation of African Americans from that of White-Americans).
Emphasize Educational Opportunity
Educational opportunity is not an area that is within direct oversight or control of the City, the Mayor, or the City Council. However, it was hard to ignore its importance in seeking to break through barriers to economic prosperity. For that reason, the following measures are included, with a recommendation to work closely with Hillsborough County Public Schools and other partners to emphasize and positively influence these critical measures.
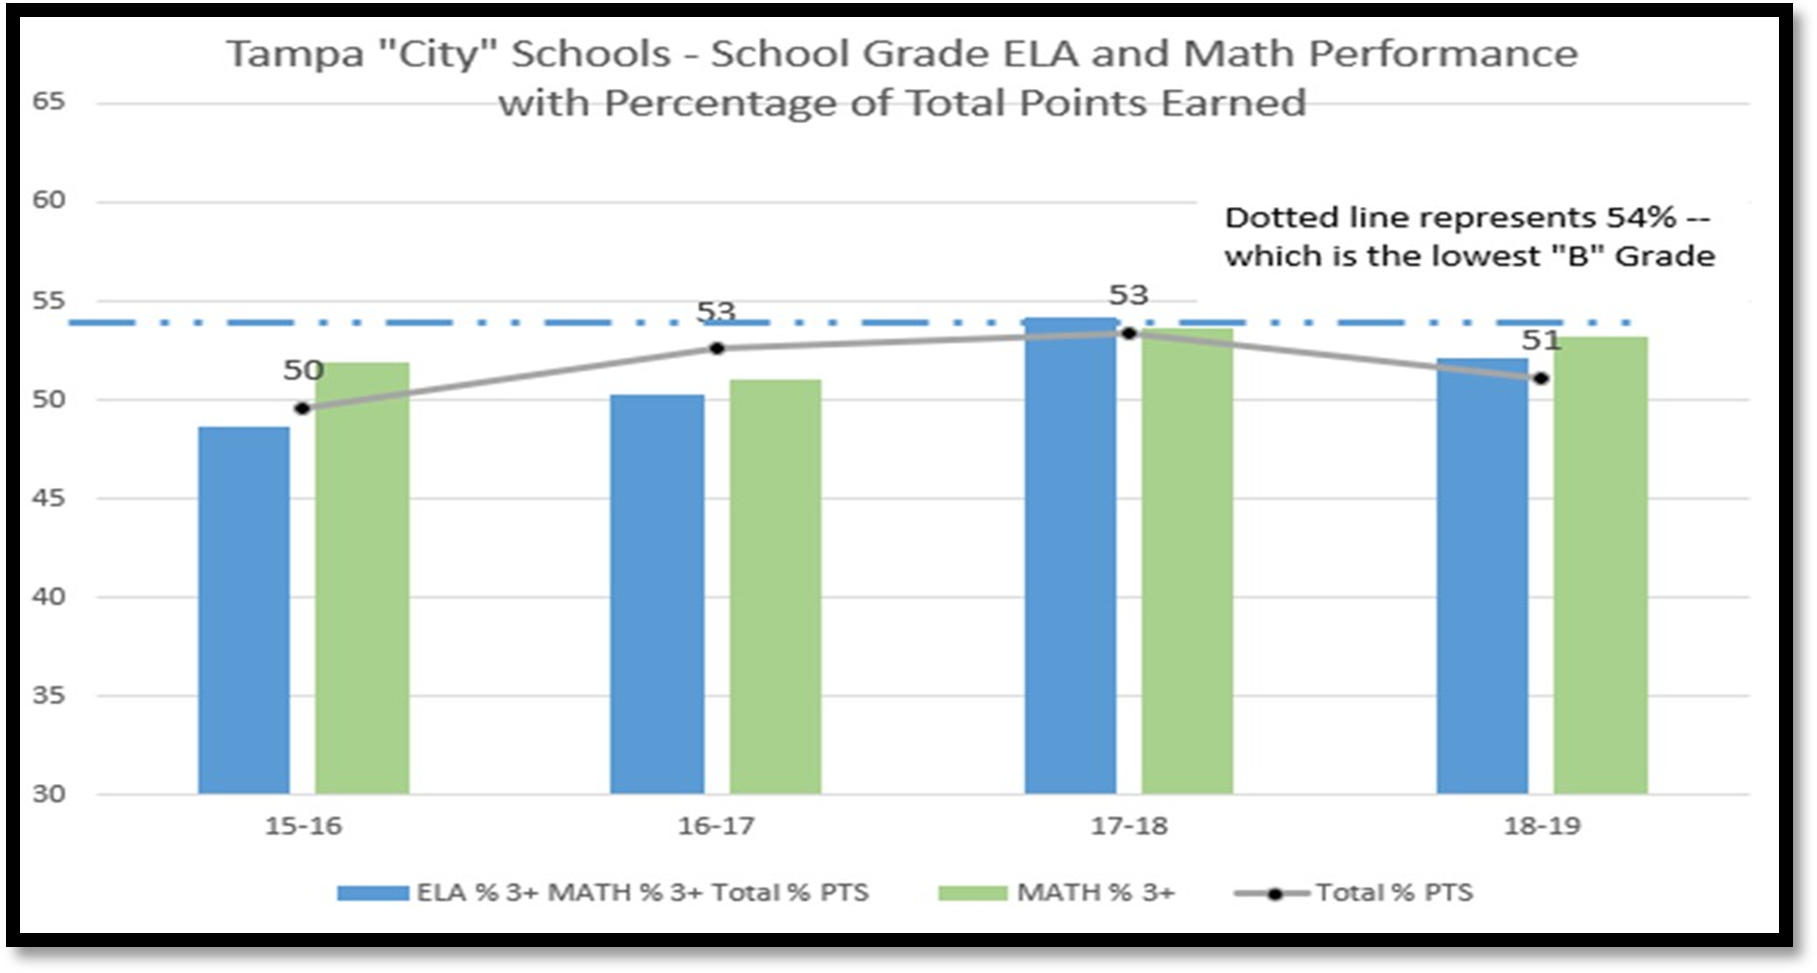
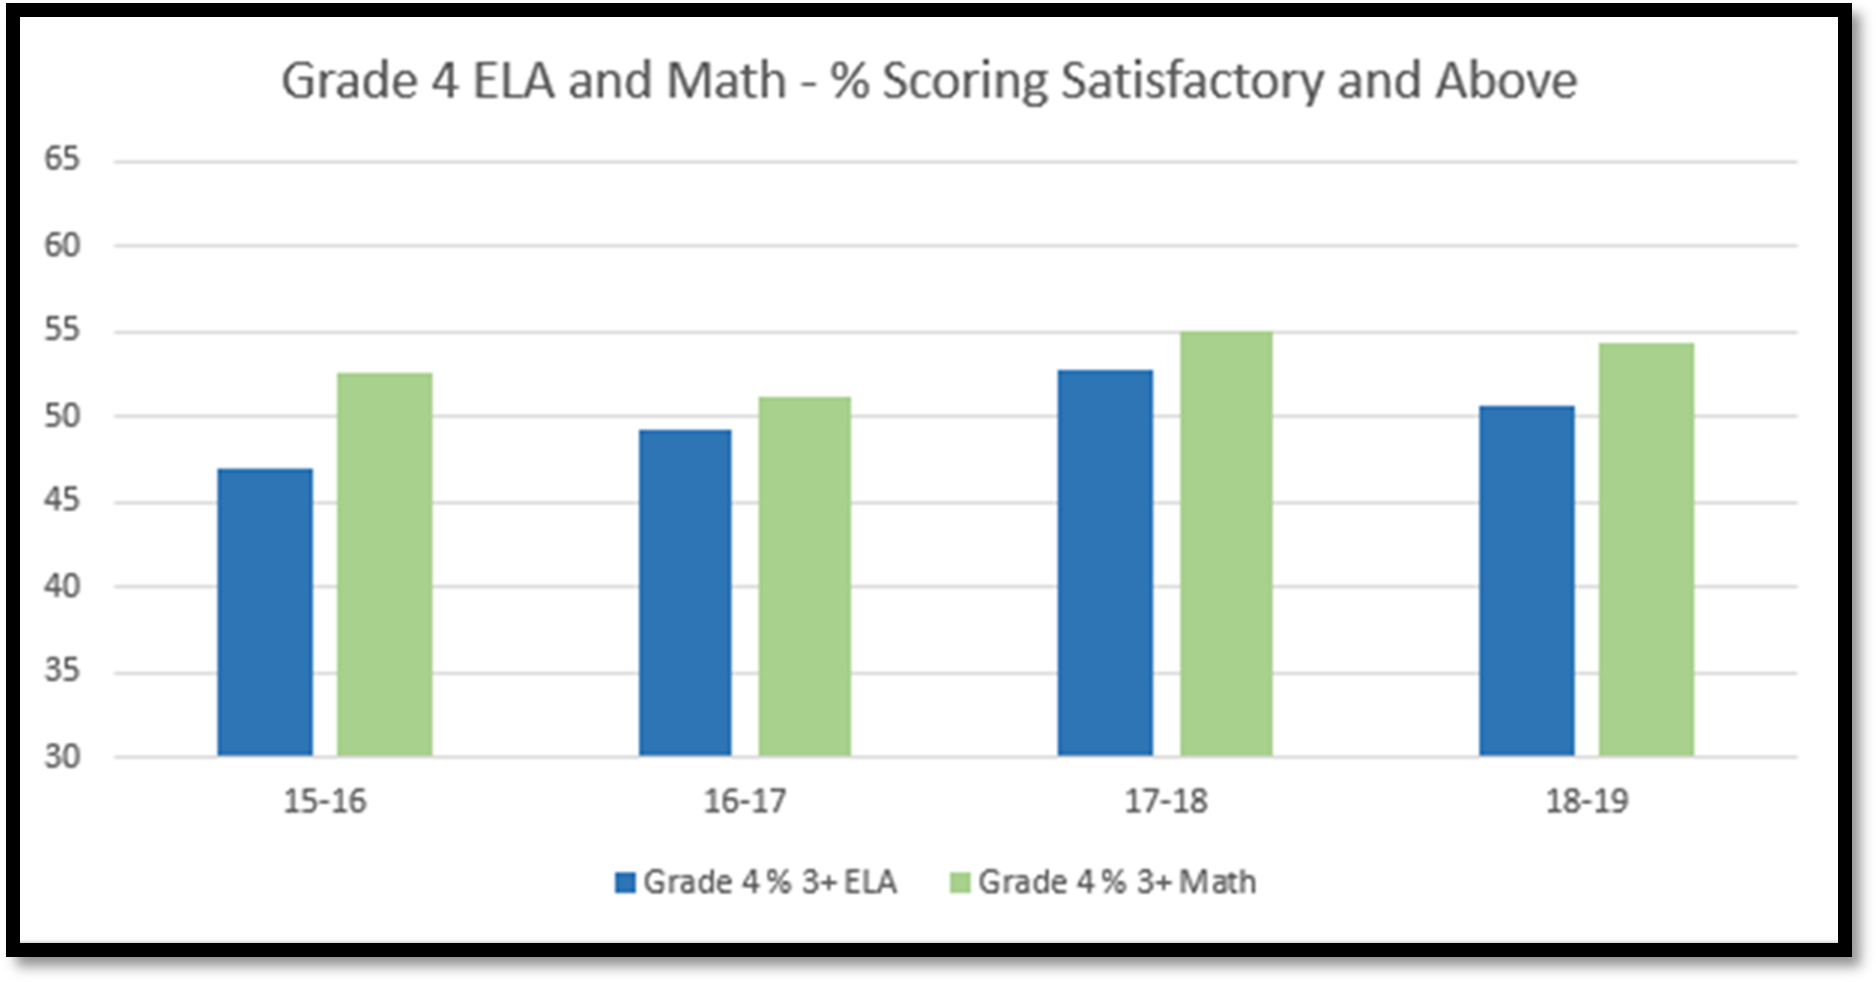
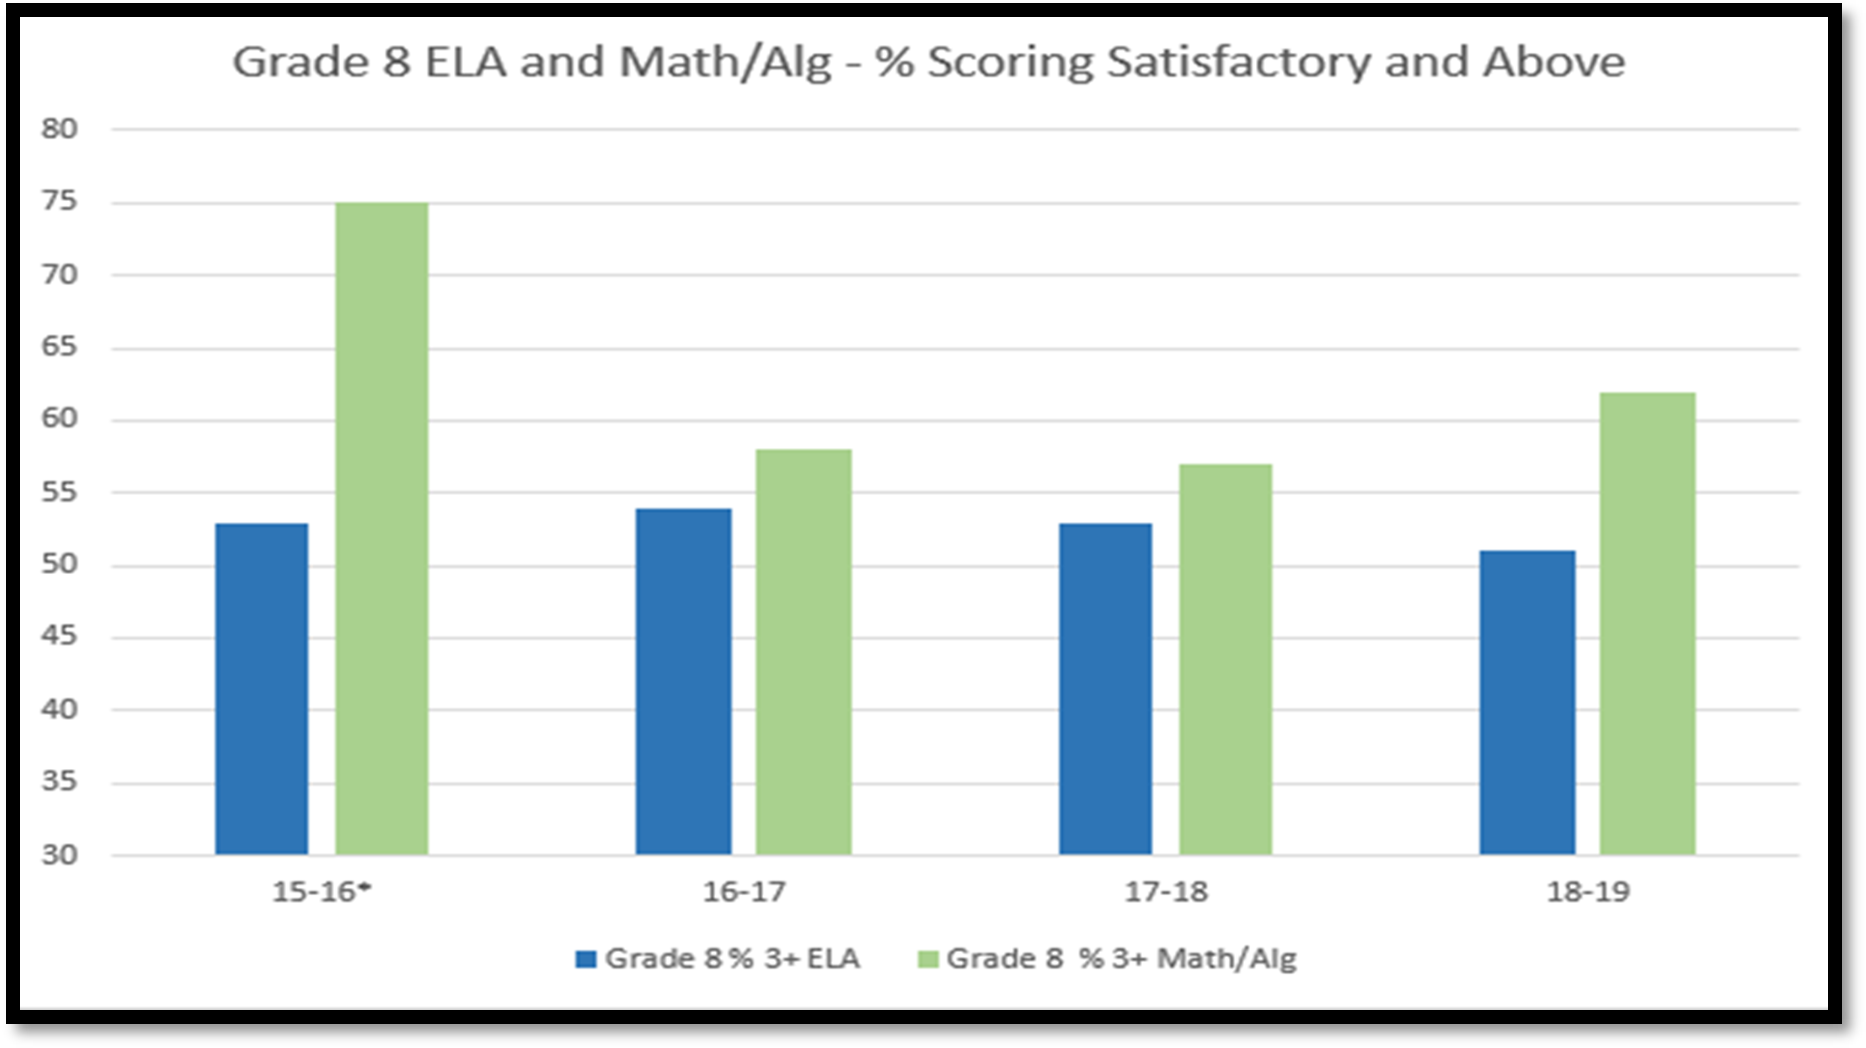
- 4th/8th Grade Math Florida Standards Assessment (FSA) - Percentage of students who took the 4th and 8th Grade Math FSA and scored a level 3 or higher.
Based on the available assessment periods, the results for Tampa students for this metric remain flat.
- High School Graduation Rate - Percentage of High School graduates in the school district of the city.
Graduation rates are measured at the District level. For Hillsborough County District schools, the graduation rate rose to 88.8% in the 2019-2020 school year, an increase from the prior year and an all-time record high, according to data from the Florida Department of Education. While overall graduation rates have been improving over the past six years, the graduation rate for Black students in Hillsborough County of 82.3% is more than 10% lower than the white student graduation rate of 92.5%. - Educational Attainment (Bachelor's degree and above) - Percentage of population, 25 years and older, who have attained a bachelor's degree or higher
Educational attainment in terms of absolute percentage has improved for Tampa over the years. In 2010 it was around 20 % and in 2019 it was 24%. Other comparable cities have also shown upward trends. On the other hand, the competitive position of Tampa was 6th (out of 6) in 2010 and was still 5th in 2019. This is largely because for other cities, educational attainment has increased at a faster rate.
There is no available data to clearly identify the factors leading to relatively slow or stagnant growth of educational attainment in Tampa. From anecdotal evidence, it may be because of slow growth of high paying jobs which need a bachelors or higher level of education in Tampa compared to other cities.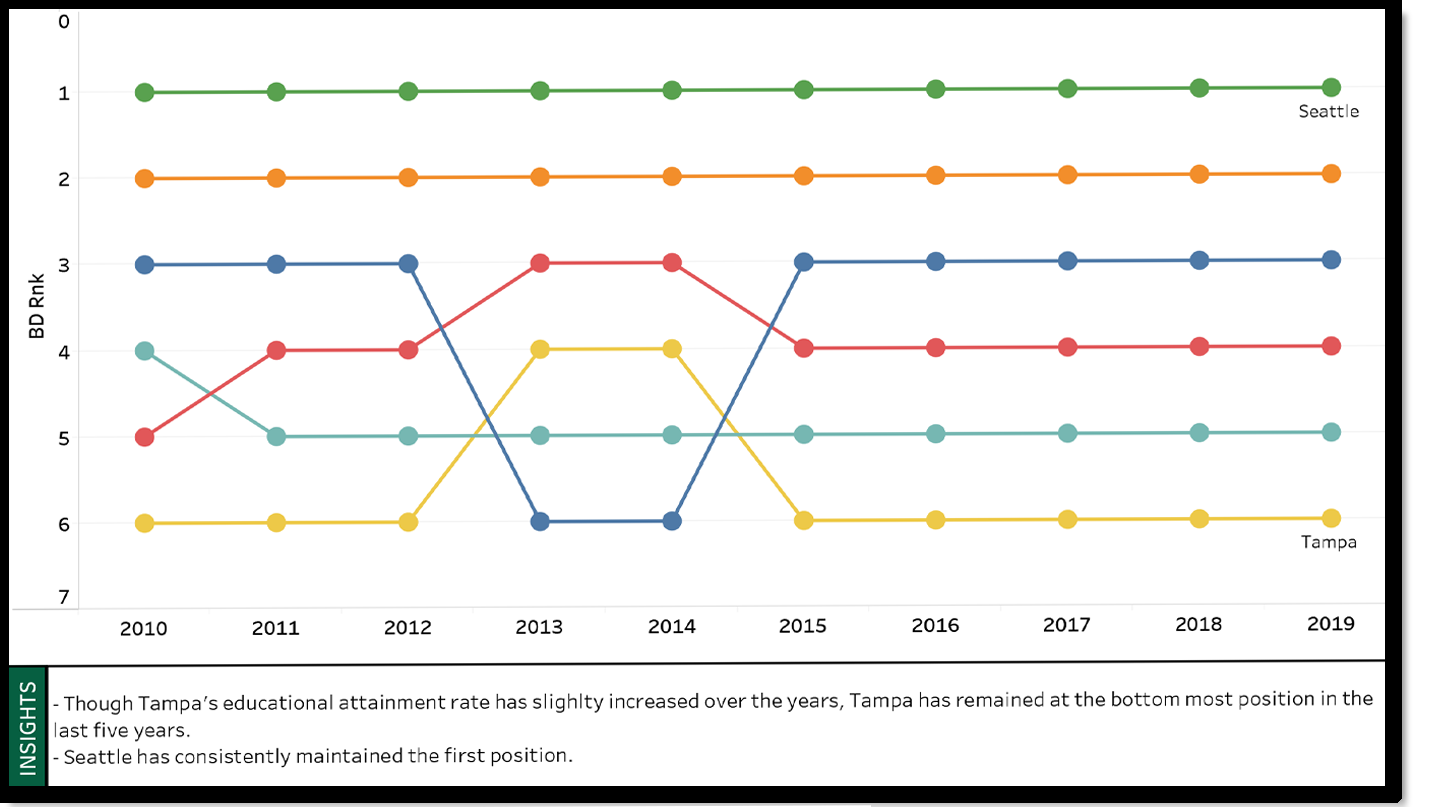
Educational Attainment Rate: Bachelor’s Degree Completion Competitive Position
Advisory Committee Recommendations
Promote Inclusive Economic Growth
Inclusive economic growth is a concept that advances equitable opportunities across every section of society. Currently, there are many organizations focused on improving economic inclusiveness in our community. The Tampa Bay Chamber, the Tampa Bay Economic Development Council, Career Source Tampa Bay, and many other private sector, advocacy, and academic/educational groups are launching initiatives focused on improving this measure. It will be important to leverage these existing programs, build on successful solutions, ensure appropriate visibility and awareness of existing programs, and inspire and/or influence new programs across all employer groups and sectors. I
Recommended Action Items
- Per Capita Income
Per Capita Income measures the mean income for every person (man, woman, and child) living in a city. It is derived by dividing the total income generated in a city in the prior 12 months by the total population of the city. The Advisory Committee recommends the following efforts to reverse the downward trend for this measure.- Work with job placement partners to identify all existing state and federal funding programs targeted at job creation and assess the effectiveness of each one for improving Tampa’s per capita income for underrepresented individuals.
- Provide information to employers regarding federal, state, and local programs intended to support the labor force and supplement income levels for the employed.
- Develop training and certification programs for the largest unemployed groups to enhance talent available for workforce opportunities and encourage employers to implement skills-based hiring.
- Leverage and build upon existing job and career path planning through organizations such as Career Source Tampa Bay to increase skill levels and drive compensation increases.
- Unemployment Rate
The Unemployment Rate is the percentage of the labor force that is without employment. An Individual is considered unemployed if he/she is willing and able to work but unable to find employment. The Advisory Committee recommends the following efforts to continue the recent positive trend for this measure.- Support efforts to market designated Opportunity Zones to promote existing businesses and attract new ones to drive job growth. Develop new programs and enhance and promote existing programs that incentivize employers to encourage greater proportion of employment from underserved communities.
- Work with employer groups and other stakeholders to assess the job skills of unemployed and underemployed individuals and encourage the use of skills-based hiring approaches, in addition to educational credentials, to expand the potential hiring pool.
Reduce Poverty
Efforts to reduce and eliminate poverty address both economic and humanitarian issues and can work to lift people out of poverty. The City of Tampa has several resources that can be helpful in this journey including the Career Source Tampa Bay Committee, representatives of Hillsborough Community College, and the One Tampa Board. These groups, and others, will need to come together to find real solutions to make meaningful improvements in these measures.
Recommended Action Items
- Poverty Rate
Poverty rate is the percentage of a population that is living below the federal poverty line as defined by the U.S. Census Bureau. The Advisory Committee recommends the following efforts to begin incremental positive improvement for this measure.- Focus on reducing poverty in specific neighborhoods like East Tampa, West Tampa, and Ybor City by providing increased structure, support, and guidance to those respective Community Redevelopment Areas.
- Encourage use of Opportunity Zones to attract more jobs, businesses, and true mixed-use developments to under-served neighborhoods.
- Transportation to Work
Enabling access to reliable and cost-effective transportation, particularly to work centers, is a key part of increasing the likelihood of long-standing employment and reducing the costs associated with personal transportation, both of which can reduce poverty. A key measure in this area is the proportion of workers who either walk or use public transit (not including bikes or scooters) to commute to work and reflects public transit availability which is an important driver affecting poverty reduction.
The Advisory Committee recommends the following efforts to begin incremental positive improvement for this measure.
- Identify core work centers in the city and neighborhoods which are currently underserved by public transportation; undertake a cost-benefit analysis with the help of USF CUTR (Center for Urban Transportation Research) to identify best practices to connect work centers to underserved population centers.
- Establish a regular mechanism to access gaps in availability of public transportation and use this data to enhance the system.
- Work to enable affordable and workforce housing in closer proximity to core work centers and encourage housing affordability across all neighborhoods to reduce the reliance on private and public transportation.
- Develop a formal partnership with USF’s Center for Urban Transportation Research (CUTR) and possibly similar organizations to encourage/incentivize targeted major employers in the three major work centers (Downtown, Westshore, Innovation District/University) to promote commuter resources.
- Explore a City Staff commuter incentive program.
- Digital Access
Access to the internet for educational and vocational purposes is critical to help reduce poverty across underserved areas. A digital access measure is the share of households with a computer and dedicated physical broadband such as fiber optic or DSL. The Advisory Committee recommends the following efforts to continue the recent positive trend for this measure.- Work with partners to establish ‘Homework Centers’ in Tampa Recreation Centers to provide a clean and safe place for students to do homework and study close to their home.
- Work with telecommunication service providers to ensure appropriate digital availability to all neighborhoods; explore and adopt best practices that have been successfully adopted in other jurisdictions.